
Explore Data in Google Looker
Explore Data in Google Looker covers dimensions, measures, pivots, totals, filters, sorting, row limits and table calculations, including percent-of-total and period-over-period comparisons.
50m 38s • Beginner • English • Subtitles available • 1280 x 720
Course Overview
Explore Data in Google Looker
Turn query results into clearer comparisons.
Explore Data in Google Looker introduces the Looker Explore workflow for building queries, refining results and working with table calculations. Follow the choices that shape the data you see, from selecting dimensions and measures to comparing values.
The course focuses on querying and interpreting results, with attention to accurate queries and troubleshooting unexpected output.
Explore Data in Google Looker: 4 essential skills
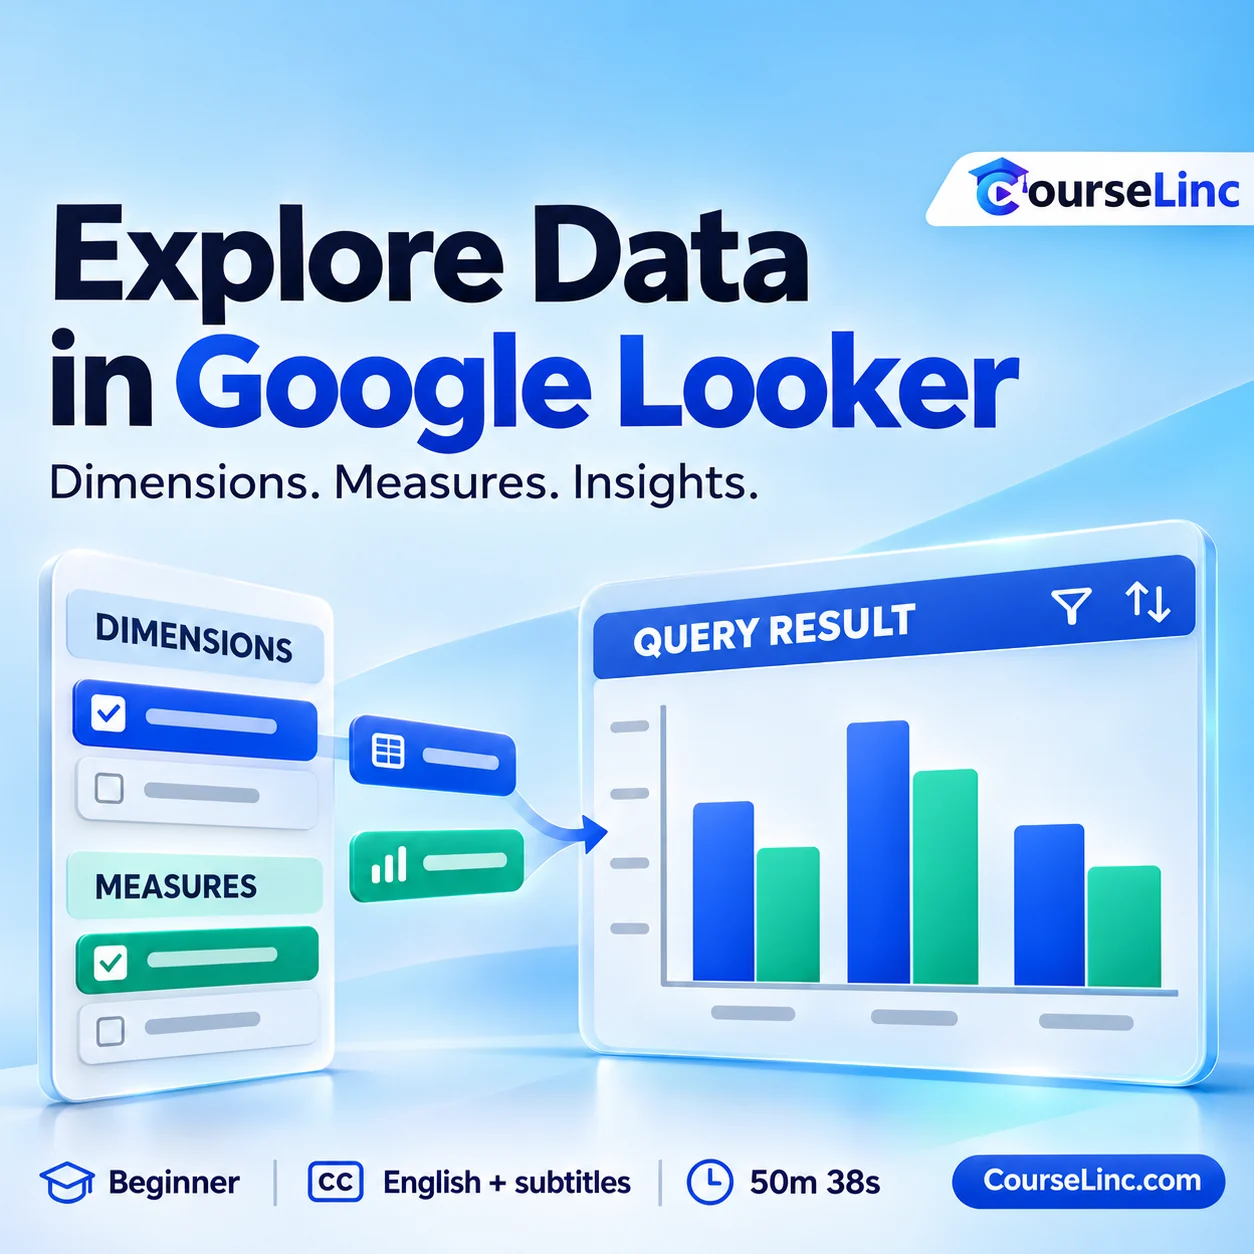
Build queries with dimensions and measures
Learn to select dimensions and measures for a query. Consider how those choices shape the result and support the question you want to explore.
Reshape results with pivots and totals
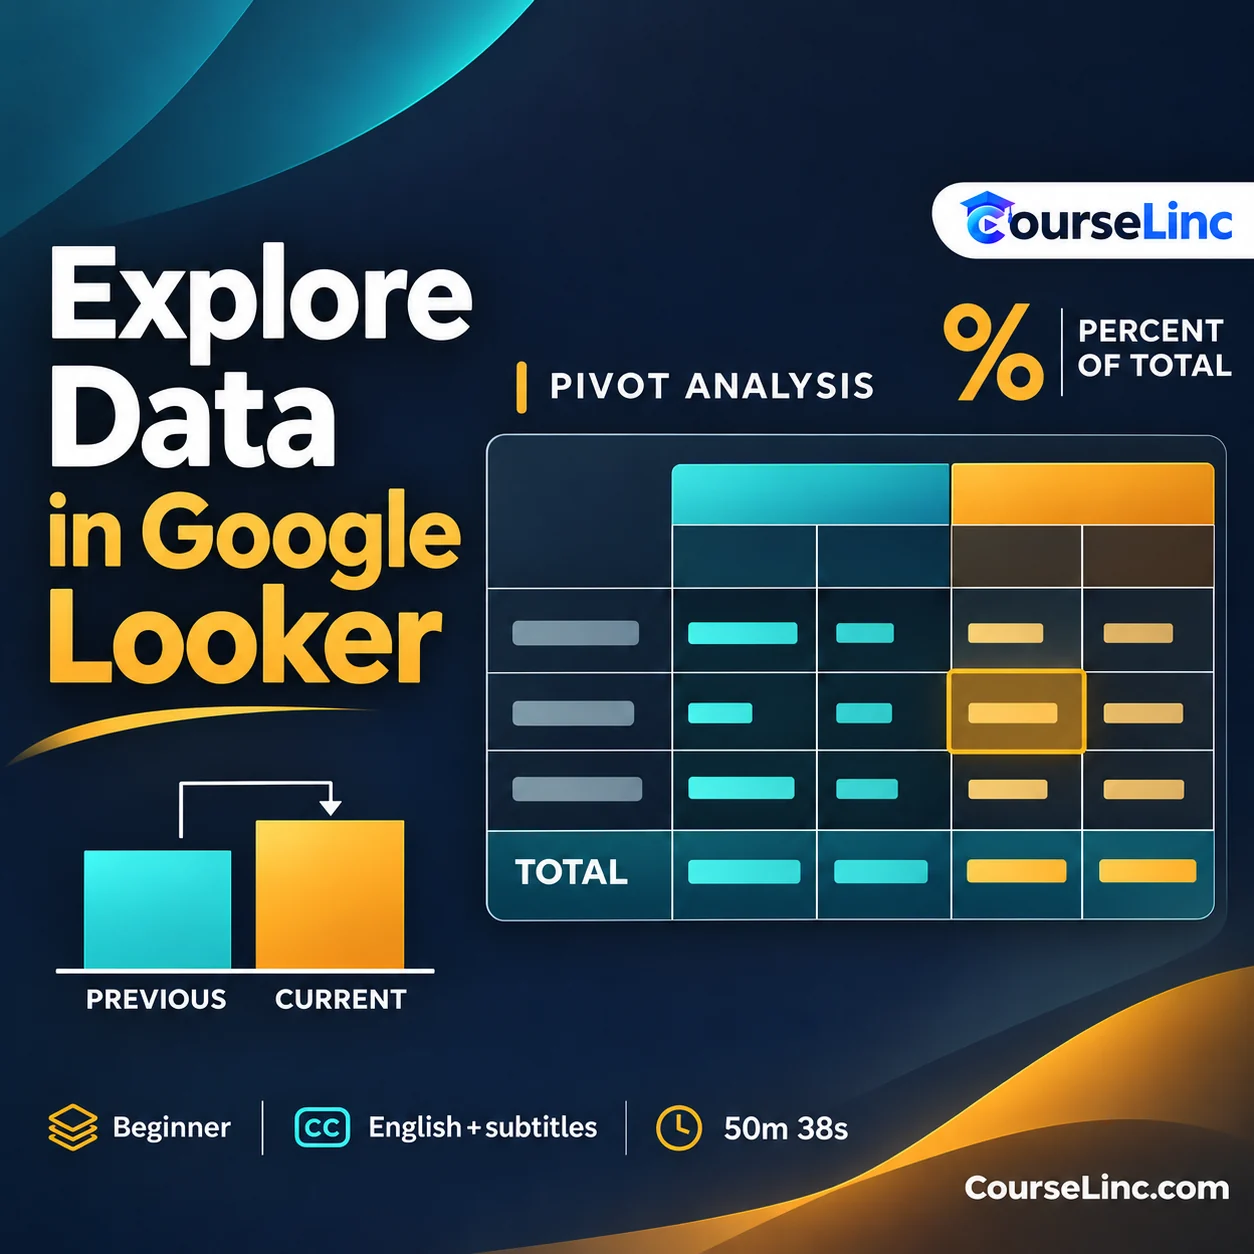
Explore pivots and totals as ways to examine query results. Bring result structure into your analysis when you need to compare the returned data.
Filter, sort and troubleshoot
Work with dimension filters, measure filters, sorting and row limits. Investigate unexpected results by reviewing the choices used to build and refine your query.
Calculate comparisons in the table
Explore table calculations for percent of total and period-over-period comparisons. Learn about offset functions as part of working with values in the result table.
Explore the course details
From a question to query results
The lessons connect dimensions and measures with pivots and totals. Follow how query choices and result structure work together, then use filters, sorting and row limits to refine what you are examining.
Working through unexpected results
Explore Data in Google Looker includes troubleshooting as part of the analysis workflow. Review query selections and result settings before interpreting the output, then explore table calculations for percentage and period comparisons.
Course format
- Duration and level
- 50 minutes 38 seconds / Beginner
- Language
- English, with subtitles available
- Video
- MP4 / H.264, 1280 x 720
- Audio
- AAC, 44.1 kHz, 2 channels
Explore related Office Productivity courses or browse more IT & Software courses on CourseLinc. For product reference, see the Official Looker table calculations reference.